At the moment, the definition of the plot size in gnuplot is somehow
unsatisfactory.
Depending on the terminal, set size reacts differently.
For example, in the png terminal, the position of the size
command does not make a difference while in the postscript terminal,
set size before set terminal is different
from after it.
In addition, set size can change the canvas of the output
even if the output size is defined explicitely.
For example,
set size 1,2
set terminal png size 320,240
leads to an output file with 320 × 480 pixels.
set terminal command
exclusively.set terminal size.)set size only changes the size of the plot, not the
canvas size. At the moment, this is already the case for
multiplots.set screen-coordinate (which
is a bad name, we should look for a better one).
The screen-coordinate command is useful to select a
special aspect ratio of the screen coordinate system.All plots use the include file canvas.inc. In addition, all plots use the patch bbsize-20051012-1450.diff to enable labels outside the range of screen coordinates 0,0 to 1,1.
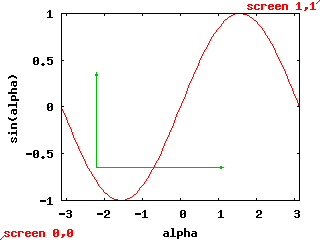
The default is a plot with screen coordinates 0,0 and 1,1 in the lower left and upper right corner, respectively:
Produced by:
| current syntax | new syntax |
|---|---|
set size 1,1 set terminal png size 320,240 set output 'canvas1.png' load 'canvas.inc' plot sin(x) notitle set output |
set screen-coordinate min 0,0 max 1,1 set terminal png size 320,240 set output 'canvas1.png' load 'canvas.inc' plot sin(x) notitle set output |
In all plots, the green arrows denote a screen coordinate range of width 0.4 and height 0.4.
Screen coordinates 0,0 and 1,1 in the lower left and upper right corner, respectively:
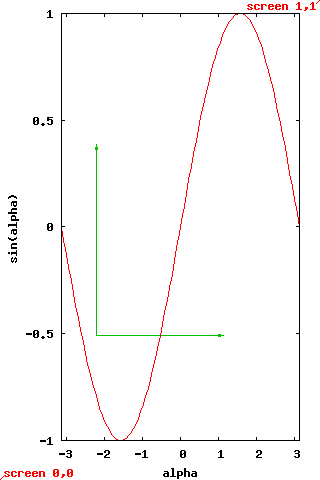
Produced by:
| current syntax | new syntax |
|---|---|
set size 1,1 set terminal png size 320,480 set output 'canvas4.png' load 'canvas.inc' plot sin(x) notitle set output |
set screen-coordinate min 0,0 max 1,1 set terminal png size 320,480 set output 'canvas4.png' load 'canvas.inc' plot sin(x) notitle set output |
Here, a plot with the size 1,1 in screen coordinates has a different size and aspect ratio than in the default case. Also, the green coordinate arrows have a different aspect ratio.
In many cases, this behaviour is intended by the user.
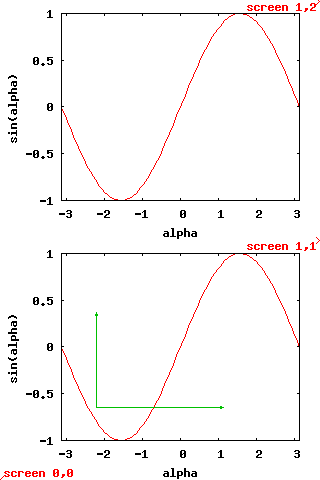
Screen coordinates 0,0 and 1,2 in the lower left and upper right corner, respectively:
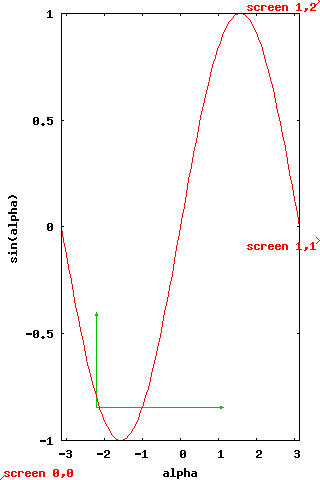
Produced by:
| current syntax | new syntax |
|---|---|
set size 1,2 set terminal png size 320,240 set output 'canvas2.png' load 'canvas.inc' plot sin(x) notitle set output |
set screen-coordinate min 0,0 max 1,2 set terminal png size 320,480 set output 'canvas4.png' load 'canvas.inc' plot sin(x) notitle set output |
The plot itself looks identical to the section before. But everything that is placed with explicit screen coordinates is placed differently. For example, the green coordinate arrows have the same size and aspect ratio as in the default case.
In many cases, also this behaviour is intended by the user.
The current syntax is unlogical here because
set terminal png size 320,240 leads to a picture of the
size 320 × 480.
The proposed new syntax would me much more logical.
Screen coordinates 0,0 and 1,1 in the lower left and upper right corner, respectively:
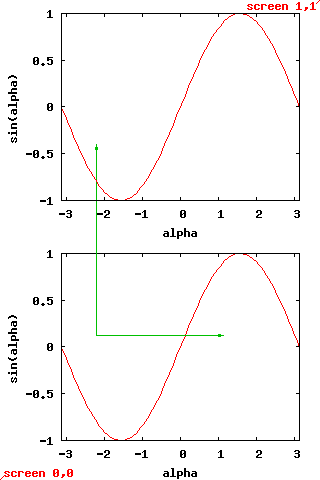
Produced by:
| current syntax | new syntax |
|---|---|
set size 1,1 set terminal png size 320,480 set output 'canvas5.png' load 'canvas.inc' set multiplot set size 1,0.5 plot sin(x) notitle set origin 0,0.5 replot unset multiplot set output |
set screen-coordinate min 0,0 max 1,1 set terminal png size 320,480 set output 'canvas5.png' load 'canvas.inc' set multiplot set size 1,0.5 plot sin(x) notitle set origin 0,0.5 replot unset multiplot set output |
In order to maintain two plots that have the same size as in the
default case, their size has to be given as 1,0.5.
Also, the green coordinate system scales by factor two in vertical
direction.
Screen coordinates 0,0 and 1,2 in the lower left and upper right corner, respectively:
Produced by:
| current syntax | new syntax |
|---|---|
set size 1,2 set terminal png size 320,240 set output 'canvas3.png' load 'canvas.inc' set multiplot set size 1,1 plot sin(x) notitle set origin 0,1 replot unset multiplot set output |
set screen-coordinate min 0,0 max 1,2 set terminal png size 320,480 set output 'canvas3.png' load 'canvas.inc' set multiplot set size 1,1 plot sin(x) notitle set origin 0,1 replot unset multiplot set output |
In order to maintain two plots that have the same size as in the
default case, their size can still be given as 1,1.
Also, the green coordinate system stays unchanged.
With current gnuplot, canvas sizes larger then 1,1 are not possible
because the clipping algorithm inhibits that unnecessarily. With the
patch
bbsize-20051012-1450.diff,
this problem can be solved.
If the function of the set size command will not be
changed in its basis, a patch similar to this one has to be applied
in my opinion.
But there still is a problem because the set size command
behaves in a strange manner because it can change the canvas size.
In my opinion, both scenarios are useful and necessary, namely maximal screen coordinates of 1,1 independent on the output size and the possibility to scale the screen axes in the bounds of the canvas, for example, to reach the same aspect ratio and scaling of the screen axes for different canvas sizes.
At last, there is a strong compatibility issue.
In many of my documents, I have used eps and epslatex plots with a
size smaller than 1,1 with extensive use of screen coordinates.
Since neither postscript nor epslatex provide a size
option, the screen coordinate system remained unchanged in all my
plots, meaning that the upper right corner has the screen coordinate
0.7,0.8, for example.
If a new syntax is introduced that supports this case, I just can change
two lines in each plot instead of many.
I believe that this problem applies to other users, too (as can be seen
out of the bug message in the mailing list, if I remember correctly).